This was an exciting project: we assisted a business in measuring calling metrics and profitability.
A simple Excel file containing call logs and billing data was submitted. With just a small dataset, we turned it into something intelligent, interactive, and easy to understand.
Key Challenges
- Large call volume every month created unwieldy datasets.
- Billing methods varied by vendor.
- No clear definitions of billing methods in the source data.
- Client needed dynamic price adjustments for what-if analysis.
Starting Simple
A simple Excel file can answer more questions than you might expect. This client had multiple vendor rate sheets, all formatted differently, which made it nearly impossible to compare or calculate true billable minutes.
Using Power Query, I combined those sheets into one unified table—turning scattered inputs into a single source of truth. From there, I created a definitions table that captured each vendor’s formula for calculating billable minutes, along with their respective sales margins (both $ and %).
With the groundwork laid, I built a pivot table with slicers, giving the client the ability to filter and analyze performance by vendor, margin, or formula type in seconds.
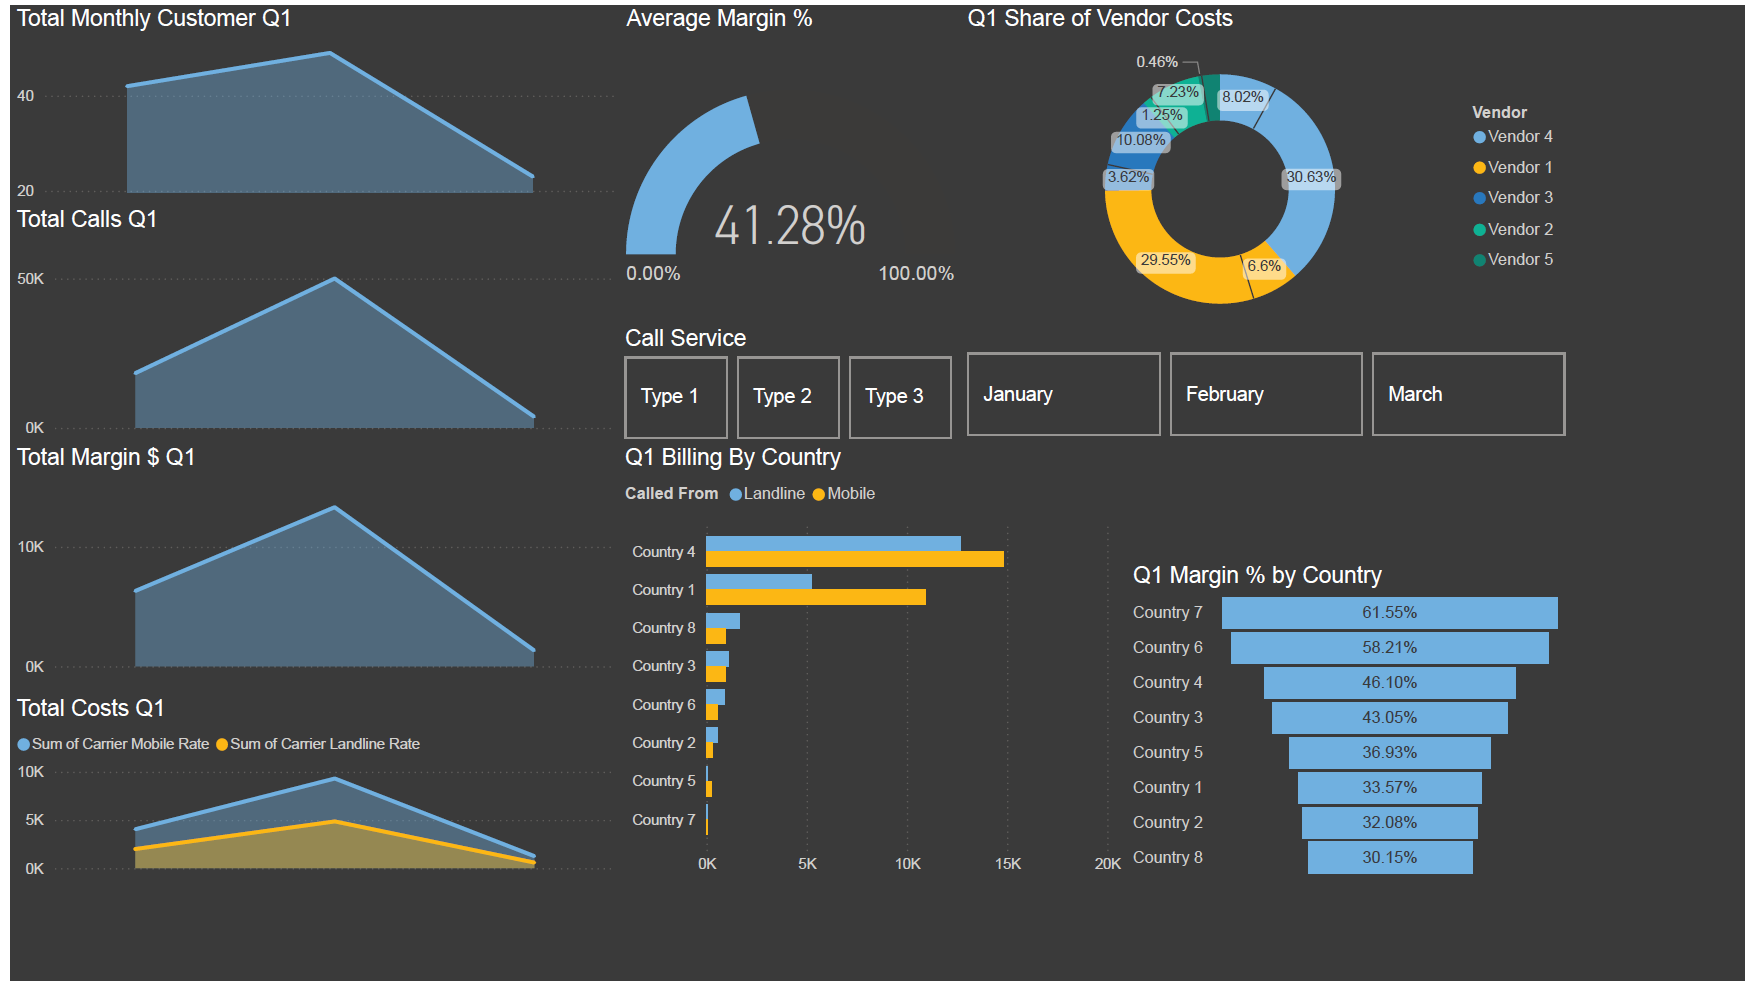
As a final step, I demoed a Power BI dashboard built on the same data model. The client loved the interactive visuals and chose to move forward with the Power BI report while also keeping their now-dynamic Excel workbook for day-to-day use.
Result: A process that once took hours of manual effort now takes minutes. A painful quarterly report turned effortless plug and play for new data. Now the client has both flexibility in Excel and deeper analytics in Power BI.

Leave a Reply